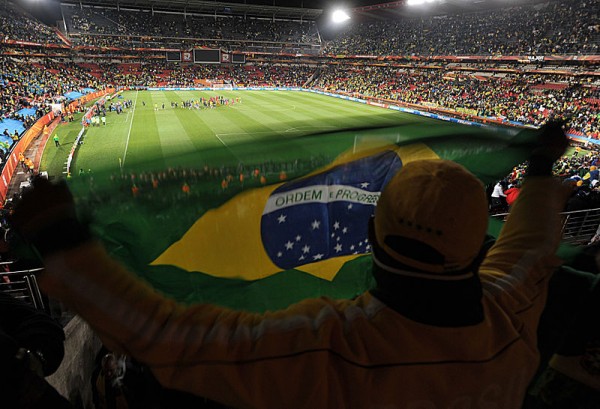
Digital Marketing and the World Cup 2014

While many people both online and off have different opinions regarding the World Cup currently being held in Brazil, there is no doubt that the event will be regarded as one of the biggest social media events in history. Below is a list of compiled statistics as to why this is:
- 3.6 billion people worldwide are expected to watch the event – 50 percent of the world’s population.
- $5.7 billion will be spent on sponsorship and commercials.
- Only 15 minutes of each 90-minute game will be dedicated to commercials.
- Brazil’s own team comes in first with the most Twitter followers – 1.46 million – followed by Mexico – 1.45 million – and Columbia – 823,000.
- An estimate by Facebook pins 500 million of its 1.28 billion users (or 39 percent) as football fans.
- Of those 39 percent, 62 percent are on Facebook every day.
- There are an estimated 350,000 tweets sent out about the World Cup every day.
- The United Kingdom, Ireland, and the United Arab Emirates tweet the most about the World Cup.
- On Instagram, over the span of five days, there have been almost 240,000 posts with hashtags related to the World Cup.
- Out of a surveyed 2,000 UK consumers, research found that 25 percent of people had plans to watch the World Cup through on demand TV, mobile phone, or tablet.
- Football fans in the UK are two-and-a-half times more likely to perform searches on a smartphone during live matches.
- In a survey from Crowdtap, they found that 74.2 percent of fans expect to simultaneously be on social media during the games.
- Of that 74.2 percent, 43.4 percent said they’d post on Facebook, 34.1 percent said they’d tweet on Twitter, and 13.1 percent said they’d blog about the World Cup.
- And what will those updates be about? Over forty-seven percent said they would update about their favorite team and/or players’ performance; 42.1 percent said they would update about their favorite ads; 38.5 percent said they would update about the performance of the opposite team and/or players; 30.5 percent said they would update about their least favorite ads.
- And finally, those surveyed asked which social media network they preferred. Sixty-five percent said they preferred Facebook. Next was Twitter (17.6%), Instagram (6.1%), Pinterest (5%), and Vine (2.9%.)
Sources:
- “11 wonderful World Cup 2014 stats & infographics.” 2014. Econsultancy.com
- “10 interesting digital marketing stats we've seen this week.” 2014. Econsultancy.com
- “World Cup brand marketing and ad spending.” 2014. OnlineSocialMedia.com
- Image Source: Agencia brasil: https://agenciabrasil.ebc.com.br/ultimasfotos?p_p_id=galeria&p_p_lifecycle=0&p_p_state=normal&p_p_mode=view&p_p_col_id=column-1&p_p_col_count=1&_galeria_railsRoute=%2Fgerenciador_galeria%2Fgaleria%2Fshow%3Fid%3D941

